Profiling with gprof
In this post I explored profiling tool called gprof.
What is profiling?
Profiling shows analysis of resource consumption when a program is executed.
The resources consumption that can be analyzed are:
- Time
- Memory
- Temporary storage
- Energy
To see how gprof analyzes the program we first need a program.
This is my program that does random math that means nothing.
Code:
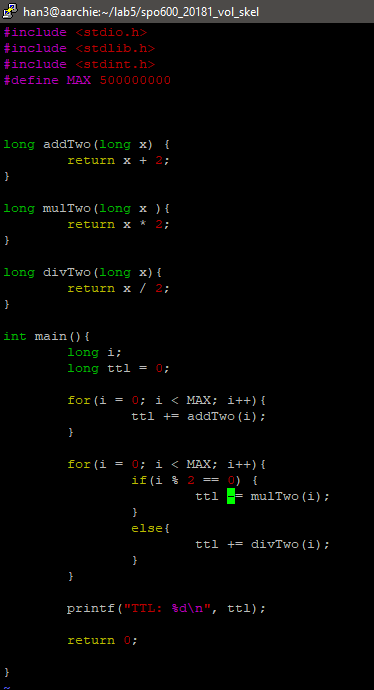
**The solution you are about to see may not be correct method. Viewer discretion is advised.**
Following the instructions in the course website, I compiled above code with
gcc -g -O2 -pg test.c -o test
gcc -g -O2 -pg test.c -o test
then ran the program to generate gmon.out file.
Once this file is created run
gprof test | less
to see the analysis
gprof test | less
to see the analysis
Analysis

Yes, there is no analysis.
It took me some time to figure out why I'm not getting any analysis.
I googled extensively and found an answer that suggested to pass -no-pie flag.
Of course this didn't work, so I decided to do just the bare minimum to use gprof
compile the code with
gcc -pg test.c -o test
Analysis
gcc -pg test.c -o test
Analysis


This looks lot better.
I guess there is some kind of issue with compilation command.
After testing around with the compilation command, it seems like -O flag is the issue.
-O2 and -O3 would not generate any analysis result.
-O2 and -O3 would not generate any analysis result.
It is possible that this is because the program is too small.
The already small program is made even smaller with optimization flag, and because the program would execute lot faster gprof is not able to analyze the program.
So let's test out this theory.
Above result is with default optimization and we'll use that for a comparison.
gcc -O0 test.c -o test


gcc -O1 -pg test.c -o test

gcc -O2 -pg test.c -o test/
gcc -O3 -pg test.c -o test

As seen from the above test results, the program I made become really small with optimization flag, hence gprof not able to profile anything.
Now let's create a PDF file of these analysis so it's easier to look at.

This analysis shows that my program has
three functions: addTwo, divTwo, and mulTwo.
addTwo function was called 500million times
divTwo and mulTwo was called 250million times
Percentages inside the parenthesis is total runtime spent in each function.
15.15% of runtime was spent in addTwo
11.82% of runtime was spent in divTwo
3.64% of runtime was spent in mulTwo
60.91% of runtime was spent in main
After looking at the analysis we can see how handy gprof can. gprof can be used to see where in the code the most time is spent. With that lead one can start to traverse deeper to find one or more places that can be optimized for better performance of the software.
Comments
Post a Comment